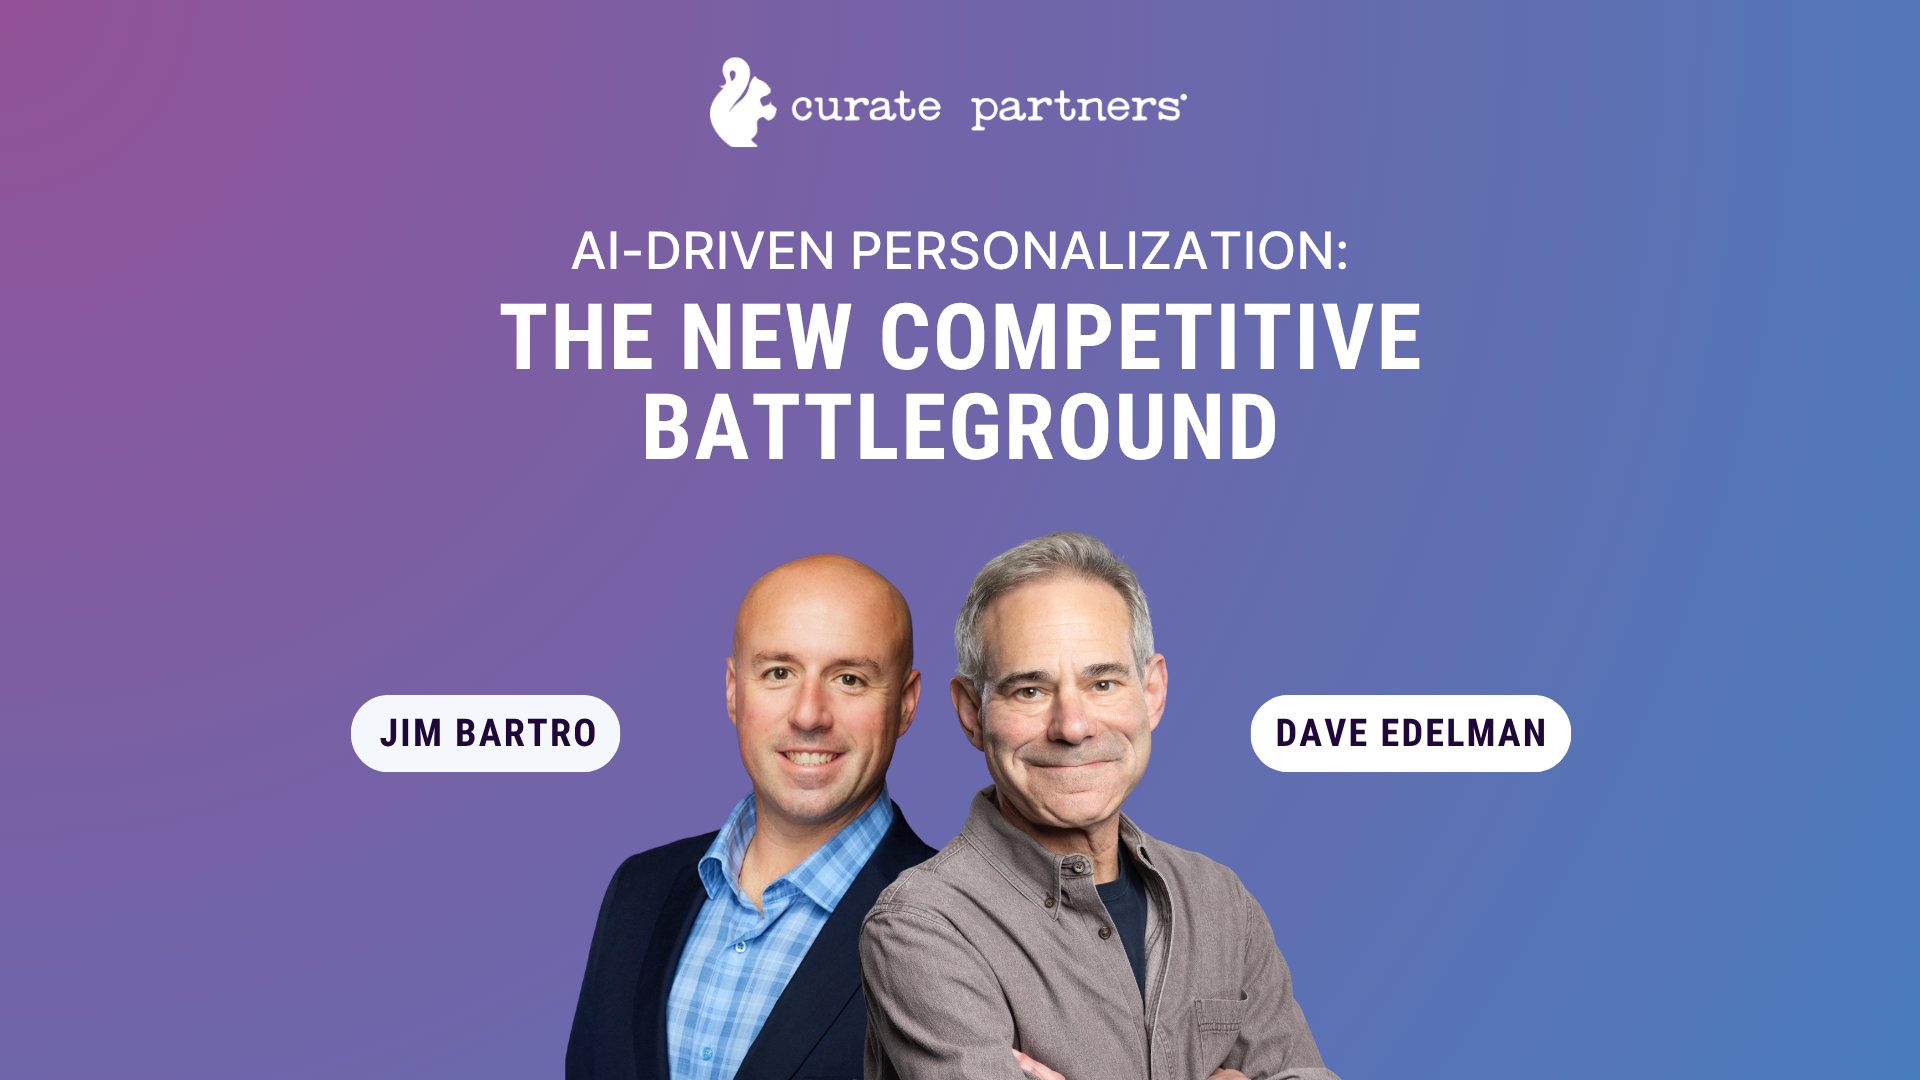
18Sep

Unlocking Business Insights with Looker: A Modern Approach to Data Exploration and BI

Looker:

Revolutionizing Data Exploration and Business Intelligence

In the fast-paced world of modern business, data is more than just an asset—it’s the foundation for informed decision-making. The ability to efficiently access, analyze, and visualize data is critical for organizations aiming to stay ahead of the competition. Enter Looker, a cutting-edge data exploration and business intelligence (BI) platform that empowers businesses to unlock deeper insights from their data.

Looker’s ease of use, powerful data modeling capabilities, and seamless integration with a wide variety of data sources make it a go-to solution for organizations looking to build a robust BI strategy. Whether you’re a business leader seeking to harness the potential of your data or a candidate aspiring to specialize in business intelligence, understanding Looker’s capabilities is essential to achieving success.

This article explores the key features of Looker, its transformative impact on businesses, and how Curate Consulting Services can connect companies with specialized Looker talent to elevate their data initiatives.

Why Looker? The Power of Data Connectivity and Integration

One of the major challenges businesses face today is managing data scattered across various platforms and systems. Looker addresses this issue by offering extensive data connectivity, supporting integrations with databases, data warehouses, cloud services, and web applications. Looker seamlessly pulls data from these disparate sources into a unified platform, enabling organizations to have a holistic view of their data.

Looker integrates with Google BigQuery, Amazon Redshift, Snowflake, MySQL, and more, making it adaptable for businesses using different data ecosystems. This flexibility ensures that no matter where the data resides, Looker can access it in real-time, allowing users to make data-driven decisions based on the most up-to-date information.

For organizations that rely on complex data environments—such as those in retail, finance, or healthcare—this broad data connectivity feature is crucial for centralizing insights, ensuring accurate reporting, and minimizing data silos.

LookML: Simplifying Data Modeling

Data modeling is the backbone of any effective business intelligence platform. Looker sets itself apart with its proprietary data modeling language, LookML (Looker Modeling Language). While traditional SQL queries can be complex and difficult to manage, LookML abstracts these complexities, making data modeling more accessible to both technical and non-technical users.

With LookML, organizations can define reusable data models that streamline the creation of consistent reports and dashboards. This is especially useful for businesses dealing with high volumes of data, as LookML ensures that everyone is working from the same, validated data sets. By abstracting SQL, LookML allows business analysts to build custom queries without writing extensive code, fostering a more collaborative and agile BI environment.

For companies looking to empower their teams to work with data more efficiently, LookML offers an intuitive solution that saves time and reduces the need for constant involvement from IT departments.

Data Exploration Made Simple

Looker shines in its ability to offer an intuitive, web-based interface for data exploration. Users can interact with data through a simple point-and-click interface, creating custom queries, applying filters, and drilling down into datasets without requiring technical expertise. Whether a user is building a report for financial forecasting or exploring customer behavior analytics, Looker enables a flexible, user-friendly approach to data discovery.

Additionally, Looker’s real-time data access ensures that users are always working with the latest information, making it easier to spot trends, monitor KPIs, and make strategic decisions.

Custom Reports and Dashboards: Tailored to Business Needs

One of Looker’s strengths is its ability to create custom reports and dashboards that cater to specific business needs. The platform’s drag-and-drop interface makes it simple to design reports that feature a wide range of visualizations, from charts and graphs to maps and tables. These visualizations help businesses communicate complex data in an easily digestible format.

Moreover, Looker’s dashboards are interactive, allowing users to drill down into data points to gain deeper insights. For business leaders, this real-time interactivity provides immediate access to critical information, making it possible to respond to challenges and opportunities as they arise.

For industries like marketing, logistics, and manufacturing, where tracking KPIs and operational metrics is crucial, Looker’s dashboards provide a clear, visual representation of performance, enabling teams to monitor trends and make data-driven adjustments.

Collaboration and Data-Driven Culture

One of Looker’s standout features is its focus on collaboration. Within the platform, users can share data insights, add comments, and discuss reports with colleagues, fostering a data-driven culture across departments. This built-in collaboration functionality is particularly useful for teams that need to work together in real-time to make decisions based on shared insights.

For enterprises, this means greater alignment between teams, reducing bottlenecks in decision-making, and improving the overall agility of the organization. Looker enables cross-functional collaboration, ensuring that teams such as sales, marketing, finance, and operations are all on the same page when it comes to interpreting data.

Data Blending: Unifying Disparate Data Sources

Looker offers data blending, a feature that allows businesses to combine data from different sources into a single view. This is especially valuable for organizations that rely on multiple data systems. By blending data, businesses can create a more comprehensive view of their operations, providing greater context and uncovering insights that may have been missed when analyzing data in isolation.

For example, a company can blend data from its customer relationship management (CRM) platform with data from its e-commerce platform to gain a complete picture of customer behavior and sales trends. This comprehensive approach enables better decision-making, particularly in customer analytics and performance monitoring.

Embedding and Extending Looker’s Capabilities

Looker’s embedding capabilities allow organizations to extend the reach of their data insights by integrating reports and visualizations into other applications or platforms. For businesses offering customer-facing products or services, Looker’s embedded analytics can enhance the user experience by providing interactive data insights directly within their applications.

Furthermore, Looker’s platform is highly extensible. With the Looker API, developers can create custom applications and data workflows that integrate seamlessly with Looker, enabling businesses to tailor their BI tools to meet unique needs.

This extensibility makes Looker an excellent choice for technology companies, service providers, and platform businesses that want to offer integrated BI capabilities as part of their product suite.

Curate Consulting Services: Finding Specialized Looker Talent

While Looker is a powerful tool, businesses often face the challenge of finding the right talent to implement and manage it effectively. This is where Curate Consulting Services steps in. We specialize in sourcing top-tier talent for organizations looking to enhance their data capabilities with Looker.

Why Partner with Curate Consulting Services?

  1. Expert Knowledge in BI and Data Analytics: With deep expertise across a range of industries, we understand the unique data needs of businesses in finance, healthcare, retail, and technology. Our consultants are experts at finding Looker specialists who can transform raw data into actionable insights.

  2. Tailored Talent Solutions: Whether you need a Looker developer to build custom data models or a data analyst to optimize reporting, we provide tailored staffing solutions that align with your business needs. We can help you fill both permanent and contract roles, ensuring that you have the right expertise to drive success.

  3. Cross-Industry Expertise: Looker’s versatility makes it suitable for businesses across various sectors. Our experience in matching talent with the right industries ensures that your company benefits from specialized knowledge and technical skill sets relevant to your business.

  4. Ongoing Support: Curate Consulting provides ongoing support throughout the hiring process, ensuring that your new talent is well-integrated into your team and equipped to deliver results from day one.

Conclusion

Looker is more than just a BI tool—it’s a platform that empowers organizations to access, explore, and visualize their data in ways that drive innovation and strategic decision-making. From its robust data modeling and real-time analytics capabilities to its collaboration features and seamless integration with other platforms, Looker is transforming how businesses approach data-driven initiatives.

18Sep

Unleashing Business Intelligence with Power BI: Transforming Data into Actionable Insights

Power BI:

Transforming Data into Actionable Insights for Business Success

In today’s competitive business landscape, data is more than just a byproduct of operations—it is the lifeblood of informed decision-making. As organizations strive to remain agile and proactive, the ability to harness, analyze, and visualize data in real-time is critical. This is where Power BI, a robust business intelligence (BI) and data visualization tool developed by Microsoft, comes into play.

Power BI is revolutionizing how companies approach data, providing users with intuitive, interactive dashboards and reports that convert raw data into actionable insights. With features that cater to both technical and non-technical users, Power BI is empowering individuals and organizations to make smarter, data-driven decisions. Let’s explore the core features of Power BI and how it’s shaping the future of business intelligence, along with insights into finding specialized talent to maximize its potential.

The Power of Power BI: Key Features Driving Business Intelligence

1. Data Connectivity

Power BI’s ability to connect to a wide array of data sources is one of its standout features. Whether you’re pulling data from on-premises databases, cloud services, web applications, or even spreadsheets, Power BI provides over 200 data connectors to ensure seamless integration. This flexibility allows businesses to unify their data across multiple platforms, giving them a consolidated view of operations.

For businesses, having real-time access to data from diverse sources enables a holistic view of performance, customer behavior, and operational efficiency. Companies can monitor key performance indicators (KPIs) and adjust strategies based on live data streams from internal systems, social media, or third-party services like Salesforce, Google Analytics, or Azure.

2. Data Transformation with Power Query

Power BI offers powerful data transformation tools via its Power Query Editor. Users can clean, shape, and model data before visualizing it, ensuring that datasets are accurate, relevant, and ready for analysis. Whether it’s merging tables, applying filters, pivoting or unpivoting data, or performing complex transformations, Power BI allows users to fine-tune their data.

For enterprises, these data transformation capabilities reduce reliance on data scientists or IT teams, empowering business analysts to prepare and manipulate data independently. This self-service model fosters greater efficiency and agility in data analysis.

3. Advanced Data Modeling

Power BI’s data modeling engine allows users to establish relationships between datasets, create calculated columns, and apply complex measures using DAX (Data Analysis Expressions). This enables businesses to go beyond simple visualizations and dive deep into data analytics for meaningful insights.

For example, a retail company could analyze the relationship between inventory levels and sales performance by connecting multiple datasets, allowing them to optimize stock and minimize overstock or shortage situations.

4. Versatile Visualizations

The hallmark of Power BI is its ability to create a wide range of compelling visualizations. Whether it’s charts, graphs, maps, or tables, Power BI allows users to visualize data in ways that best communicate insights. Additionally, users can take advantage of custom visuals or create their own, ensuring flexibility and creativity in reporting.

The interactive nature of Power BI’s visualizations allows users to filter and drill down into specific data points, encouraging exploratory analysis. This is particularly valuable in sectors like finance and healthcare, where real-time trends and patterns need to be uncovered quickly for decision-making.

5. Interactive Dashboards and Reports

Power BI enables users to pin multiple reports and visuals to a single canvas, creating interactive dashboards that provide an at-a-glance overview of key metrics and KPIs. These dashboards can be updated in real-time, allowing for continuous monitoring of performance.

In a world where quick decision-making is essential, having a dashboard that aggregates all relevant data into a single view can be a game-changer. Leaders can make informed decisions based on the most up-to-date information available, fostering a more responsive business environment.

6. Natural Language Querying

One of Power BI’s standout features is its Q&A functionality, which allows users to query their data using natural language. This makes data exploration more accessible to non-technical users who may not be familiar with complex query languages. Simply asking questions like “What were our sales last quarter?” or “How did customer satisfaction trend last year?” can yield instant, visually appealing results.

For companies with distributed teams, this feature can significantly improve cross-functional collaboration by enabling team members across different departments to access and interpret data insights without specialized training.

7. Mobile Accessibility

With the world becoming increasingly mobile, Power BI ensures that users can access their reports and dashboards on the go. The Power BI Mobile app allows individuals to view, interact with, and share their data from anywhere—whether they’re in the office, at a client site, or on the road.

For sales and field teams, having mobile access to Power BI dashboards enables real-time decision-making during customer meetings, ensuring they always have the latest data at their fingertips.

8. AI and Machine Learning Integration

Power BI’s integration of artificial intelligence (AI) and machine learning (ML) brings predictive analytics to the forefront. Businesses can now identify trends, anomalies, and patterns, helping them anticipate future outcomes. The ability to leverage AI for automated data insights and anomaly detection adds an extra layer of intelligence to decision-making.

This capability is invaluable in sectors like finance, where predictive models can forecast revenue or customer churn, allowing businesses to be proactive rather than reactive.

9. Seamless Integration with Microsoft Ecosystem

Power BI’s close integration with the Microsoft ecosystem makes it the go-to BI tool for organizations already using platforms like Excel, Azure, SharePoint, and Teams. This integration simplifies data sharing, collaboration, and data governance, offering a unified solution for businesses that rely on the Microsoft stack.

For example, users can import data directly from Excel, analyze it in Power BI, and then share insights via Microsoft Teams—creating a seamless workflow across multiple platforms.

10. Security and Compliance

Power BI places a strong emphasis on security and compliance. With features such as row-level security, encryption, and data loss prevention, organizations can ensure their data remains protected. Integration with Azure Active Directory enables seamless authentication and authorization for a secure user experience. Power BI also complies with industry standards, making it suitable for highly regulated industries such as healthcare and financial services.

Curate Consulting Services: Finding Specialized Power BI Talent

While Power BI provides a powerful platform for business intelligence, unlocking its full potential requires skilled professionals who understand both the technical aspects of the tool and the business context in which it operates. This is where Curate Consulting Services comes in.

Why Choose Curate Consulting for Power BI Talent?

  1. Expertise in Business Intelligence: With years of experience across various industries, we understand the unique challenges businesses face when implementing BI solutions. Our expertise spans data analysis, reporting, and BI strategy development, ensuring we find the right talent to meet your needs.

  2. Tailored Talent Solutions: Whether you’re looking for Power BI developers to create custom visuals or data analysts to extract insights, Curate Consulting has access to a pool of highly specialized Power BI talent. We ensure a tailored hiring process to match the right candidates with the right roles—whether on a contract, contract-to-hire, or permanent basis.

  3. Industry-Specific Knowledge: Our experience in industries such as healthcare, finance, retail, and technology allows us to provide candidates who understand the specific BI challenges in your field. We focus on finding talent that not only has the technical know-how but also the industry insight to make data meaningful.

  4. Seamless Integration with Your Team: Curate Consulting goes beyond simple recruitment—we ensure that the talent we provide integrates smoothly with your team, offering ongoing support to ensure a successful deployment of Power BI initiatives.

Conclusion

Power BI’s versatility, ease of use, and deep integration with the Microsoft ecosystem make it a top choice for organizations looking to unlock the potential of their data. With its robust data connectivity, advanced modeling, and AI-enhanced capabilities, Power BI enables businesses to transform raw data into actionable insights that drive decision-making.

18Sep

QlikView vs. Qlik Sense: Unleashing the Power of Data for Businesses

QlikView and Qlik Sense:

Unlocking the Power of Data Visualization for Business Intelligence

In today’s data-driven world, businesses are swimming in a sea of information. The challenge lies not in the availability of data but in making sense of it. To navigate this ocean of information effectively, companies need robust tools that can transform raw data into actionable insights. That’s where QlikView and Qlik Sense come into play—two powerful business intelligence (BI) platforms developed by Qlik, designed to facilitate data exploration, analysis, and decision-making.

Whether you are a candidate looking to sharpen your BI skill set or an enterprise leader seeking specialized talent for your organization, understanding the distinction between QlikView and Qlik Sense is crucial for maximizing data’s potential.

QlikView: A Developer’s Playground for Complex Data

QlikView is often regarded as a developer-centric platform that offers a high degree of control and customization. Built on an associative data model, QlikView allows users to interact with data in a non-linear, intuitive manner. By clicking on any data point, you can instantly see its impact on the rest of the dataset—offering a real-time, holistic view of your information.

Key Features of QlikView:

  1. Associative Data Model: Unlike traditional BI tools that force users into predefined queries, QlikView’s associative model allows for dynamic exploration of data relationships. This enables users to ask and answer questions they hadn’t initially thought of.
  2. Scripting for Data Transformation: For those with a technical background, QlikView’s proprietary scripting language offers vast flexibility in transforming, loading, and modeling data from various sources. This feature makes it ideal for complex, large-scale data projects.
  3. In-Memory Data Storage: QlikView’s in-memory engine ensures rapid performance by storing compressed data, enabling faster queries and real-time data interaction.
  4. Extensions and Customization: Developers can further enhance QlikView’s functionalities using custom extensions, allowing for specialized visualizations and integration with other business tools.
  5. Windows-Based Development: QlikView’s Windows-based environment provides a stable and familiar interface for developers looking to build intricate, bespoke applications.

Use Cases for QlikView:

QlikView’s strength lies in environments where data relationships are complex and require deep customization. It’s often favored in industries such as finance, where the ability to drill down into granular data is essential. The platform’s script-based approach and powerful associative model also make it popular in retail, manufacturing, and healthcare—sectors that deal with large, multi-source datasets.

However, while QlikView is powerful, it demands a certain level of technical expertise. As a result, it’s often best suited to organizations that have a dedicated BI or IT team capable of managing the complexities of scripting and data modeling.

Qlik Sense: Democratizing Data for Everyone

While QlikView is developer-centric, Qlik Sense democratizes data access by offering a more user-friendly, self-service BI platform. It builds on the same associative data model that powers QlikView but introduces features aimed at making data analysis accessible to non-technical users. Business users, rather than just IT professionals, can now engage in meaningful data exploration, making Qlik Sense a popular choice for organizations looking to scale BI efforts across departments.

Key Features of Qlik Sense:

  1. User-Friendly Interface: Qlik Sense’s drag-and-drop interface is designed for ease of use. This allows users to create dashboards and reports without needing to write code, making it more accessible to a broader audience.
  2. No Scripting Required: While Qlik Sense can handle complex data scenarios, it removes the need for manual scripting in most cases. Its self-service data preparation tools make it easier for users to clean and model data on their own.
  3. Responsive Design: With Qlik Sense, dashboards and reports automatically adapt to the screen size of any device—whether desktop, tablet, or smartphone. This makes it a versatile tool for today’s mobile-first business environments.
  4. Collaborative Development: Qlik Sense was designed with collaboration in mind. Multiple users can simultaneously create and edit applications, promoting a more collaborative approach to data analysis and decision-making.
  5. Cloud and On-Premise Options: Flexibility is key with Qlik Sense. Organizations can choose between cloud-based deployments for scalability and accessibility or on-premises options for stringent data governance.

Use Cases for Qlik Sense:

Qlik Sense is well-suited for businesses looking to empower non-technical employees to participate in the data analysis process. This self-service model works exceptionally well in sales, marketing, and customer experience roles where business users need to make decisions quickly based on real-time data. Its storytelling capabilities also allow users to create narratives around data, which is critical for presentations and reporting in executive decision-making contexts.

Choosing Between QlikView and Qlik Sense

The choice between QlikView and Qlik Sense largely depends on an organization’s specific needs and technical capacity. If you’re looking for a highly customizable solution with extensive control over data transformation and modeling, QlikView is your go-to platform. However, if ease of use, collaboration, and mobile access are your primary concerns, Qlik Sense is likely a better fit.

At Curate Consulting Services, we recognize the importance of aligning the right technology with the right talent. Whether your organization is leaning toward QlikView for its complex, developer-driven capabilities or Qlik Sense for its user-friendly, self-service approach, we can help you find the specialized Qlik talent to drive your data initiatives forward.

Curate Consulting Services: Your Partner for Specialized Qlik Talent

Finding the right talent to implement and manage a BI platform like Qlik can be challenging. These tools, while powerful, require a specific skill set to maximize their potential. At Curate Consulting Services, we pride ourselves on our ability to source and place specialized talent for organizations looking to enhance their data capabilities.

Why Partner with Curate Consulting Services?

  1. Industry Expertise: With deep expertise across industries such as healthcare, finance, retail, and technology, we understand the unique data challenges businesses face. This allows us to match you with candidates who not only have the technical skills but also the industry knowledge to deliver results.
  2. Tailored Talent Solutions: Whether you need a QlikView developer for complex scripting tasks or a Qlik Sense expert to drive user adoption across teams, our talent pool includes experienced professionals who can meet your specific needs.
  3. End-to-End Support: From initial consultation to final placement, we offer end-to-end talent solutions that ensure a seamless hiring process. Our goal is to find the perfect match for your organization, ensuring that the talent we provide aligns with your business objectives and company culture.
  4. Flexible Staffing Options: We understand that every business is different. That’s why we offer flexible staffing options, including contract, contract-to-hire, and permanent placements, ensuring you have the talent you need when you need it.

Conclusion

As businesses increasingly rely on data to drive decisions, the importance of choosing the right BI tool cannot be overstated. Both QlikView and Qlik Sense offer robust solutions for data visualization and analytics, but they cater to different user bases and organizational needs. At Curate Consulting Services, we help businesses navigate these choices and find the specialized talent necessary to implement these tools successfully. Whether you’re a candidate looking to enhance your BI skills or a business leader seeking the perfect hire, we’re here to help you thrive in the data-driven world.

17Sep

Harnessing SAP BusinessObjects for Data-Driven Decision Making: A Comprehensive Guide

Harnessing the Power of SAP BusinessObjects:

Elevate Your Data-Driven Decision Making

In today’s hyper-competitive business landscape, making decisions without data is like flying blind. Companies are increasingly relying on business intelligence (BI) platforms to turn vast amounts of raw data into actionable insights that can drive better outcomes, whether that be improving customer satisfaction, enhancing supply chain efficiency, or maximizing revenue.

SAP BusinessObjects is a leading suite of BI tools designed to help organizations manage, analyze, and visualize their data with precision and ease. Developed by SAP, a global leader in enterprise software, SAP BusinessObjects provides a comprehensive platform for making data-driven decisions, enabling businesses to maintain a competitive edge in their respective industries.

In this article, we will explore the key features of SAP BusinessObjects, its applications across industries, and how Curate Consulting Services can help you find specialized SAP BusinessObjects talent to meet your organization’s needs.

What is SAP BusinessObjects?

SAP BusinessObjects is a powerful suite of business intelligence applications that allows users to analyze and report on business data. Its tools are designed to accommodate a wide variety of business needs—from creating pixel-perfect enterprise reports to designing dynamic dashboards and conducting advanced predictive analytics.

SAP BusinessObjects enables decision-makers at all levels of the organization to access insights, create their own reports, and collaborate with others, all while ensuring that the underlying data remains secure and governed. The platform integrates seamlessly with SAP’s enterprise software, such as SAP ERP and SAP BW, and can also connect to external, non-SAP data sources.

Key Features of SAP BusinessObjects

  1. Business Intelligence Tools: SAP BusinessObjects offers a diverse range of BI tools, including Crystal Reports, Web Intelligence, Lumira, Dashboards (formerly Xcelsius), and Analysis for Office. These tools serve different purposes—from highly formatted, static reporting to self-service BI, where users can create their own dynamic visualizations without needing extensive technical skills.

  2. Data Connectivity: SAP BusinessObjects is designed to connect to a broad range of data sources, including databases, data warehouses, cloud platforms, and SAP applications. This versatility allows organizations to create a unified view of their data, even when it’s stored in disparate systems.

  3. Data Visualization: The suite provides robust data visualization capabilities, allowing users to design interactive and visually compelling charts, graphs, and dashboards. These visualizations help communicate complex insights in a more accessible format, making it easier for decision-makers to understand and act on the data.

  4. Self-Service BI: Tools like Web Intelligence and Lumira empower users across the organization to generate their own reports and dashboards. This self-service functionality democratizes access to data, enabling non-technical users to explore insights without relying on IT or data science teams.

  5. Advanced Analytics: For businesses that require deeper insights, SAP BusinessObjects integrates with advanced analytics tools, allowing users to run predictive models and conduct complex statistical analysis. This is particularly valuable for industries such as finance and manufacturing, where understanding future trends can lead to more proactive decision-making.

  6. Mobile Accessibility: In a world where remote work and mobility are increasingly important, SAP BusinessObjects provides mobile accessibility. Users can access reports and dashboards on smartphones and tablets, ensuring that data-driven decision-making can happen anywhere, anytime.

  7. Enterprise Reporting: One of the standout tools in the suite, Crystal Reports, is widely used for creating highly formatted, pixel-perfect reports. This tool supports complex reporting needs and can be embedded into web and desktop applications, making it a favorite for businesses that require detailed and precise reports.

  8. Collaboration and Governance: SAP BusinessObjects includes built-in collaboration tools that allow users to share reports, dashboards, and insights with their colleagues. At the same time, the platform offers strong data governance features, ensuring that only authorized users have access to sensitive data.

Real-World Applications: SAP BusinessObjects Across Industries

SAP BusinessObjects is used across a wide array of industries to drive data-driven decisions. Its flexibility and integration capabilities make it a valuable asset for various departments, from finance to human resources, across sectors such as:

  • Finance: Financial organizations use SAP BusinessObjects to manage everything from financial reporting to compliance. By leveraging advanced analytics and predictive models, finance teams can gain better visibility into market trends, improve risk management, and optimize investments.

  • Healthcare: In the healthcare sector, SAP BusinessObjects helps providers monitor patient outcomes, analyze clinical data, and manage hospital resources. The platform’s robust data governance features ensure compliance with healthcare regulations such as HIPAA.

  • Retail: Retailers use SAP BusinessObjects to track customer behavior, manage inventory, and monitor sales performance. The platform enables the creation of dynamic dashboards that provide real-time insights into business operations, allowing for more agile decision-making.

  • Manufacturing: Manufacturers benefit from SAP BusinessObjects by tracking production efficiency, optimizing supply chains, and monitoring equipment performance. Predictive analytics capabilities allow manufacturers to anticipate and mitigate production delays, reducing downtime and improving overall efficiency.

  • Human Resources: HR departments use SAP BusinessObjects to analyze workforce performance, track employee engagement, and manage talent acquisition processes. With its self-service BI capabilities, HR managers can create their own reports and dashboards, empowering them to make faster, more informed decisions.

Curate Consulting Services: Your Partner in Finding SAP BusinessObjects Talent

While SAP BusinessObjects offers immense value, having the right team in place to implement and manage this powerful suite is crucial. This is where Curate Consulting Services can help.

We specialize in connecting businesses with top-tier BI professionals who have experience working with SAP BusinessObjects. Whether you need a developer to build custom reports, a data analyst to extract insights, or a BI architect to design and deploy your SAP BusinessObjects environment, we have access to the talent you need.

Why Choose Curate Consulting?

  1. Tailored Staffing Solutions: We don’t believe in a one-size-fits-all approach. At Curate Consulting, we work closely with our clients to understand their specific needs and match them with the right SAP BusinessObjects experts, whether for a short-term project or a long-term engagement.

  2. Expertise Across Industries: With experience working across industries, our consultants are well-versed in how different sectors leverage SAP BusinessObjects. This means we can find you talent that not only understands the technology but also knows how to apply it in your industry context.

  3. Access to Specialized Talent: Our talent pool includes SAP-certified professionals who specialize in BI, data analytics, and enterprise reporting. These experts can help your organization unlock the full potential of SAP BusinessObjects, ensuring you get the most value from your investment.

  4. Flexible Engagement Models: Whether you’re looking for permanent hires, contract workers, or project-based consultants, Curate Consulting offers flexible engagement models that suit your specific staffing requirements.

The Future of SAP BusinessObjects and Business Intelligence

The role of business intelligence is only becoming more critical as businesses face increasing pressure to make faster, smarter decisions. SAP BusinessObjects is poised to remain a leader in this space by continuing to evolve and adapt to new technologies, such as artificial intelligence (AI), machine learning (ML), and predictive analytics.

As organizations grow more data-centric, having tools like SAP BusinessObjects integrated into their operations will be essential for maintaining a competitive edge. However, the value of these tools is only fully realized when paired with the right talent to implement, manage, and optimize them.

Conclusion: Make the Most of Your Data with SAP BusinessObjects

SAP BusinessObjects provides businesses with a powerful platform to analyze, visualize, and act on their data. Its versatility, scalability, and integration capabilities make it a popular choice for organizations across industries.

17Sep

Sisense: A Comprehensive BI Solution for Transforming Data into Actionable Insights

Unlocking the Power of Sisense:

Transforming Complex Data into Actionable Insights

Unlocking the Power of Sisense: Transforming Complex Data into Actionable Insights

In today’s data-driven world, the ability to gather, analyze, and act on insights from vast amounts of information is crucial to business success. Companies are inundated with data from every possible source—sales figures, customer interactions, marketing efforts, supply chain metrics, and more. The challenge is not just collecting this data but making sense of it in a way that drives better decisions and strategic action.

This is where Sisense shines.

Sisense is a business intelligence (BI) and data analytics platform that helps businesses transform complex data into easy-to-understand, actionable insights. Known for its scalability, ease of use, and ability to handle large datasets from diverse sources, Sisense is a game changer for organizations looking to gain a competitive edge through data-driven decision-making.

Whether you’re an enterprise leader seeking to streamline operations, or a candidate aspiring to join a team working with cutting-edge BI tools, understanding how Sisense can add value is key. In this article, we’ll explore the platform’s most powerful features and discuss how Curate Consulting Services can help you find specialized talent to maximize your investment in Sisense.

What is Sisense?

At its core, Sisense is a unified platform designed to simplify the process of turning data into visual reports and dashboards. It caters to businesses of all sizes, offering robust features that enable users to blend data from multiple sources, perform in-depth analysis, and present findings in an intuitive format.

But what makes Sisense stand out in the crowded BI landscape?

  1. Ease of Use: Sisense offers a drag-and-drop interface that is easy enough for non-technical users while still powerful enough for data scientists and engineers. This democratizes data access across the organization, ensuring everyone from business leaders to front-line employees can explore data and make informed decisions.

  2. Scalability: Whether you’re a startup with limited data or a global enterprise managing vast datasets, Sisense can scale to your needs. Its elastic data model is designed to handle data growth seamlessly, allowing your analytics capabilities to evolve alongside your business.

  3. Data Integration: With Sisense, businesses can connect to a wide variety of data sources, from traditional databases and spreadsheets to cloud-based services like AWS and Google Cloud. This makes it easy to bring all your data together for a unified view of your operations.

  4. AI and Machine Learning: Sisense doesn’t just present historical data; it empowers users to predict future trends. With built-in AI and machine learning capabilities, organizations can run predictive models and create advanced visualizations that show not only what happened, but what is likely to happen next.

Sisense: Key Features That Set It Apart

1. Data Integration and Preparation

Sisense offers seamless data integration with multiple sources, including databases, cloud platforms, web applications, and even spreadsheets. This flexibility is crucial for businesses with diverse data environments.

Additionally, Sisense simplifies the data preparation process. It includes tools for data cleaning, shaping, and modeling, allowing users to blend data from multiple sources into a single analysis. The platform’s ETL (Extract, Transform, Load) features make it easy to handle both structured and unstructured data, providing users with a cohesive dataset to work with.

2. Elastic Data Model

Sisense uses an elastic data model, designed to handle large and complex datasets without compromising on performance. As businesses grow and their data requirements expand, the platform’s architecture scales to accommodate more users, larger datasets, and more complex queries.

This means that whether your organization handles a few gigabytes of data or terabytes, Sisense can keep up without slowing down.

3. Interactive Visual Analytics

Data without the right visualization can often lead to more confusion than clarity. Sisense provides robust visual analytics tools that allow users to create a variety of charts, graphs, maps, and dashboards. These interactive visualizations help users spot trends, anomalies, and opportunities at a glance, making it easier for decision-makers to act.

These dashboards are not only visually appealing but also highly interactive. Users can drill down, filter, and explore the data to uncover deeper insights, making the tool valuable for both strategic planning and day-to-day operations.

4. AI and Machine Learning Capabilities

Sisense isn’t just about looking at past data—it helps businesses predict the future. With integrated AI and machine learning tools, users can create predictive models and run statistical analysis. This is especially valuable for industries like finance, healthcare, and e-commerce, where anticipating trends can lead to better resource allocation, risk mitigation, and overall strategy.

Imagine a healthcare provider predicting patient volumes based on historical data, or an e-commerce company forecasting customer demand during holiday seasons. Sisense provides the predictive insights needed for such scenarios.

5. Web-Based Dashboards and Mobile Access

In a fast-paced business environment, access to insights anytime, anywhere is crucial. Sisense offers web-based dashboards that can be accessed from any device, including mobile phones. This ensures that decision-makers are always connected to their data, whether they’re in the office, at home, or on the go.

This mobile-first approach makes Sisense an ideal platform for businesses with geographically dispersed teams or remote workforces.

Curate Consulting Services: Your Partner in Finding Specialized Sisense Talent

While Sisense offers a range of powerful features, it takes skilled professionals to fully unlock its potential. At Curate Consulting Services, we specialize in connecting businesses with top-tier talent in the BI and data analytics space. Whether you’re looking for a Sisense developer, data analyst, or BI expert, we have the resources and expertise to help you find the right fit.

Why Curate Consulting Services?

  1. Customized Staffing Solutions: We understand that every organization has unique needs. That’s why we offer tailored staffing solutions, ensuring that you get professionals with the right skills to meet your specific Sisense requirements.

  2. Specialized Talent: Our talent pool includes Sisense experts who can manage everything from data integration and preparation to dashboard creation and predictive analytics. Whether you need someone for a short-term project or a long-term engagement, we’ve got you covered.

  3. Flexible Engagement Models: We provide flexible staffing options—whether you’re looking for full-time employees, part-time consultants, or project-based contractors. Our goal is to match you with the best talent in a way that works for your business.

Sisense in Action: Use Cases Across Industries

Sisense is used across a wide range of industries for business intelligence, data analysis, and reporting. Some common use cases include:

  • Healthcare: Hospitals and clinics use Sisense to track patient outcomes, analyze resource utilization, and predict future healthcare trends.

  • Finance: Financial institutions rely on Sisense to monitor market trends, analyze risk, and optimize investment strategies through predictive analytics.

  • Retail and E-commerce: Retailers use Sisense to understand customer behavior, optimize pricing strategies, and improve operational efficiency by analyzing sales and inventory data.

  • Manufacturing: Sisense helps manufacturers monitor production efficiency, analyze supply chain performance, and reduce downtime by analyzing real-time data.

Conclusion: Unlock the Power of Sisense with Curate Consulting

Sisense provides businesses with the tools they need to turn data into actionable insights. Its ability to integrate data from multiple sources, scale with growing data needs, and provide interactive visualizations makes it a valuable asset for any organization.

17Sep

Unlock the Power of Data with Tableau: A Comprehensive Guide for Businesses and Professionals

Unlocking the Power of Data:

How Tableau Transforms Data Analytics for Businesses

In today’s fast-paced business environment, data has become one of the most valuable assets for organizations across all industries. Whether it’s to enhance decision-making, predict trends, or track performance, businesses are increasingly reliant on data-driven insights. Yet, the ability to interpret and act on large volumes of data is often challenging. That’s where tools like Tableau come in—empowering both technical and non-technical users to transform raw data into actionable insights.

This blog post delves into Tableau, a powerful and widely-used data visualization and business intelligence (BI) software. Not only will we explore the key features of Tableau and its applications, but we’ll also discuss how Curate Consulting Services can help organizations find specialized Tableau talent for their staffing needs, ensuring that businesses maximize the potential of their data.

What is Tableau?

Tableau is a comprehensive data visualization and BI tool designed to help individuals and organizations see and understand their data. Known for its intuitive, drag-and-drop interface, Tableau allows users to create interactive and visually appealing dashboards, reports, and charts with ease. Whether you’re a business leader tracking performance metrics or a data scientist conducting in-depth analysis, Tableau has the versatility to cater to different data needs.

Key Features of Tableau:

  • Data Visualization: Tableau excels in transforming raw data into meaningful, easy-to-understand visuals. These can take the form of graphs, charts, maps, or interactive dashboards, providing users with clear insights from complex data sets.

  • Ease of Use: With Tableau, even users with minimal technical skills can create detailed visualizations. The drag-and-drop interface simplifies the process, allowing users to build data stories without needing to write code.

  • Wide Data Connection: Tableau’s ability to connect to various data sources—from Excel spreadsheets to databases like MySQL, cloud platforms like AWS, and even APIs—makes it a valuable asset for businesses dealing with diverse data sources.

  • Real-Time Data Access: In a fast-moving business world, having access to real-time data is crucial. Tableau’s ability to connect to live data sources enables businesses to make timely decisions based on the latest information.

  • Data Blending: A unique feature that allows users to combine data from multiple sources into a single visualization, enabling cross-functional insights and a holistic view of business operations.

  • Advanced Analytics and Forecasting: Tableau offers built-in analytics tools, enabling users to run statistical models, perform trend analysis, and forecast future outcomes—all within a few clicks.

  • Collaboration and Sharing: Data becomes even more powerful when shared across teams. Tableau allows users to publish dashboards and reports to Tableau Server or Tableau Online, enabling collaboration among colleagues or clients.

  • Mobile Access: Tableau isn’t limited to desktops. Its compatibility with mobile devices allows users to access dashboards and visualizations on the go, ensuring that business insights are always within reach.

The Importance of Data-Driven Decision-Making in Business

In the age of digital transformation, businesses that can effectively leverage data have a significant competitive advantage. Tableau empowers decision-makers to identify trends, spot inefficiencies, and seize opportunities by presenting data in an intuitive, visual format.

For instance, consider an e-commerce company using Tableau to analyze customer behavior. Through data visualization, they can identify which products are most popular, which marketing strategies are driving conversions, and where there are opportunities to improve customer retention. Without Tableau, sifting through large datasets to extract these insights would be a complex, time-consuming process.

Additionally, with its real-time data capabilities, Tableau allows businesses to make informed decisions in rapidly changing environments. For example, logistics companies can use Tableau dashboards to track shipping statuses in real-time, while financial institutions might use it to monitor real-time stock market data for decision-making.

Tableau Use Cases Across Industries

Tableau is used across a wide range of industries, each benefiting from the tool’s ability to create customized visualizations and dashboards:

  • Healthcare: Tableau helps healthcare organizations monitor patient outcomes, track resource utilization, and improve operational efficiency through data.

  • Finance: Financial institutions use Tableau to track performance metrics, forecast market trends, and manage risks through real-time data monitoring.

  • Retail and E-Commerce: Businesses in the retail sector leverage Tableau to analyze customer data, optimize pricing strategies, and enhance marketing efforts.

  • Education: Tableau allows educational institutions to visualize student performance data, analyze enrollment trends, and assess curriculum effectiveness.

  • Manufacturing: By using Tableau, manufacturers can optimize supply chains, reduce waste, and improve product quality by analyzing production data.

Curate Consulting Services: Finding the Right Tableau Talent

As powerful as Tableau is, it takes skilled professionals to fully unlock its potential. That’s where Curate Consulting Services comes in. We understand that hiring the right talent is critical for businesses looking to harness the power of Tableau. Whether you’re looking for data analysts, business intelligence experts, or Tableau developers, our team specializes in finding the top talent that meets your organization’s unique needs.

At Curate Consulting, we don’t just fill positions—we ensure that our clients are equipped with the specialized skills necessary to transform their data strategy. We work with organizations across industries to deliver top-tier Tableau talent for both short-term projects and long-term engagements.

Here’s how we can support your business:

  1. Customized Staffing Solutions: We take a personalized approach to staffing, ensuring that we find the right Tableau professionals who understand your industry and its specific data challenges.

  2. Flexible Engagement Models: Whether you need full-time Tableau experts or contractors for a specific project, we offer flexible staffing solutions tailored to your business requirements.

  3. Continuous Support and Training: At Curate Consulting, we don’t just provide staffing solutions; we also offer continuous support and training to ensure that your team stays ahead of the latest Tableau updates and trends.

The Future of Tableau and Data Analytics

As businesses continue to place increasing importance on data-driven decision-making, tools like Tableau will only grow in relevance. With advancements in machine learning, AI, and predictive analytics, the future of Tableau lies in its ability to not just visualize data but also provide deeper insights and forecasting capabilities.

Imagine a future where Tableau seamlessly integrates AI-driven insights into your dashboards, offering predictive recommendations on the next best action for your business. Organizations that invest in Tableau today are setting the foundation for smarter, more data-centric operations tomorrow.

Conclusion: Transform Your Business with Tableau

In today’s competitive landscape, data is the key to making informed decisions that drive business success. Tableau offers a user-friendly, robust platform for organizations to visualize and analyze their data, unlocking powerful insights that can guide strategy and operations.

16Sep

Unlocking Data Insights with Logi Analytics: Seamless Embedded BI Solutions for Web and Mobile Applications

Unlocking Data Insights with Logi Analytics:

Seamless Embedded BI Solutions for Web and Mobile Applications

In the rapidly evolving world of business intelligence (BI), organizations are constantly searching for ways to unlock actionable insights from their data. Whether it’s improving operational efficiency, enhancing customer engagement, or driving strategic decision-making, data has become the core currency of today’s digital age. Enter Logi Analytics—a powerful platform that enables businesses to create and embed interactive data visualizations, reports, and dashboards directly into their web and mobile applications.

In this article, we will explore how Logi Analytics stands out as a robust BI and analytics platform, its key features, benefits, and applications across industries. We’ll also highlight how Curate Consulting Services plays a pivotal role in helping organizations find specialized talent to maximize the potential of Logi Analytics for their business.

What is Logi Analytics?

Logi Analytics is a BI and analytics platform designed to help organizations turn their data into insightful, actionable visualizations. The platform’s core strength lies in its ability to embed analytics directly into existing applications, providing users with the ability to analyze and visualize data without leaving the software they use daily.

Logi Analytics is highly flexible and customizable, enabling developers to create rich, interactive dashboards, reports, and visualizations that blend seamlessly into any web or mobile application. With Logi Analytics, organizations can deliver data-driven experiences to both internal users and external customers, empowering everyone to make smarter, more informed decisions.

Key Features of Logi Analytics

Logi Analytics offers a comprehensive suite of tools and features that make it a leading choice for embedded BI solutions. Let’s take a closer look at its most notable capabilities:

  1. Data Integration
    One of Logi Analytics’ key strengths is its ability to connect to a wide variety of data sources, including databases, web services, APIs, and flat files. With pre-built data connectors, organizations can integrate data from diverse sources for unified analysis and reporting.

  2. Development Environment: Logi Studio
    Logi Studio serves as the primary development environment where users can design and build BI applications. With a drag-and-drop interface, developers and non-technical users alike can create custom visualizations, reports, and dashboards.

  3. Data Modeling and Transformation
    Logi Analytics supports robust data modeling features, allowing users to clean, aggregate, and transform data before visualization. This ensures that only relevant, accurate data is used for analysis, leading to more meaningful insights.

  4. Interactive Visualizations
    The platform provides a broad range of interactive data visualizations, including charts, graphs, maps, and tables. Users can customize these visualizations to match their branding and adjust interactivity to meet specific business requirements.

  5. Ad Hoc Reporting
    Logi Analytics empowers end-users to create ad hoc reports without relying on IT or data teams. This self-service functionality allows users to explore data, generate their own reports, and drill down into details, fostering a culture of data exploration.

  6. Customizable Dashboards
    Users can create interactive dashboards by combining multiple visualizations into a single view. Dashboards can be customized to display key performance indicators (KPIs) or other metrics, providing at-a-glance insights for decision-makers.

  7. Embedded BI Solutions
    What sets Logi Analytics apart is its specialization in embedded analytics. Organizations can seamlessly integrate interactive visualizations, dashboards, and reports into their existing software applications, providing users with in-context data insights.

  8. Security and Authentication
    Logi Analytics prioritizes data security, offering features such as user authentication, role-based access control, and data encryption. This ensures that sensitive information is protected, and only authorized users can access it.

  9. Multi-Device Support
    With responsive design capabilities, Logi Analytics ensures that BI applications are accessible across devices—desktops, tablets, and smartphones—enabling users to access data insights from anywhere.

  10. Scalability
    Logi Analytics is built to handle large datasets and can accommodate growing user bases as an organization’s data and analytics needs evolve. This scalability ensures that the platform remains performant even as demand increases.

Benefits of Logi Analytics

1. Data-Driven Decision-Making

By delivering real-time insights directly to users within their existing applications, Logi Analytics empowers organizations to make data-driven decisions faster. Interactive visualizations and reports make it easier to identify trends, track performance, and optimize business processes.

2. Seamless Embedded Analytics

One of Logi Analytics’ standout features is its ability to embed BI capabilities directly into software applications. This means users don’t need to switch between multiple tools to access data—they can view and interact with reports and dashboards in the same environment they use daily.

3. Self-Service Analytics and Ad Hoc Reporting

Logi Analytics reduces the dependency on IT or data teams by enabling end-users to create their own reports. This self-service functionality allows users to filter, customize, and explore data in real-time, enhancing productivity and data literacy across the organization.

4. Enhanced Customer Experience

For customer-facing applications, Logi Analytics provides organizations with the ability to offer interactive, data-rich dashboards that improve customer engagement. For example, software vendors can deliver analytics to customers as a value-added feature, enhancing the user experience.

5. Business Process Optimization

With Logi Analytics, organizations can analyze and optimize key business processes. Whether it’s improving supply chain efficiency, enhancing customer service, or optimizing sales pipelines, the platform provides actionable insights to streamline operations.

6. Security and Compliance

In industries such as healthcare, finance, and government, ensuring data security and compliance is paramount. Logi Analytics integrates with existing authentication systems and offers encryption to safeguard sensitive data, ensuring that organizations meet regulatory requirements.

Applications of Logi Analytics

Logi Analytics is widely used across various industries to enhance data-driven decision-making and embed analytics within applications. Here are some key use cases:

1. Software Vendors

Logi Analytics allows software vendors to offer embedded analytics within their products. By delivering real-time visualizations and dashboards, vendors can create value-added features for customers, helping them differentiate their products in the market.

2. Healthcare

In the healthcare sector, Logi Analytics can be used to provide interactive dashboards that track patient outcomes, monitor operational performance, and identify trends in healthcare delivery. By embedding analytics into electronic health record (EHR) systems, clinicians can access critical insights without leaving their workflow.

3. Financial Services

Financial institutions use Logi Analytics to provide customers with interactive reports on investment performance, financial transactions, and market trends. Embedding these capabilities into banking and investment platforms enhances the user experience and supports informed decision-making.

4. Manufacturing

Manufacturers can leverage Logi Analytics to monitor production processes, supply chain performance, and equipment utilization. With real-time data at their fingertips, manufacturers can identify bottlenecks and improve operational efficiency.

5. eCommerce

E-commerce platforms can use Logi Analytics to offer merchants detailed insights into sales performance, customer behavior, and inventory levels. This data-driven approach allows merchants to optimize their strategies and improve profitability.

How Curate Consulting Helps You Find Specialized Logi Analytics Talent

As organizations seek to implement Logi Analytics for their BI and data visualization needs, the right talent is essential for success. This is where Curate Consulting Services comes in.

At Curate Consulting, we specialize in connecting businesses with top-tier BI professionals, including developers, data analysts, and engineers skilled in Logi Analytics. Our talent pool includes experts who can design, implement, and customize embedded BI solutions tailored to your specific business needs.

Whether you need a developer to integrate Logi Analytics into your application or a data specialist to create impactful dashboards and reports, we provide access to skilled professionals who can bring your vision to life. With our extensive industry experience, we ensure that your organization has the right team in place to make the most of Logi Analytics.

Conclusion: The Power of Embedded BI with Logi Analytics

Logi Analytics is a powerful platform that enables organizations to integrate data-driven insights directly into their web and mobile applications. With features like ad hoc reporting, customizable dashboards, and embedded analytics, Logi Analytics empowers businesses to make smarter, data-driven decisions.

16Sep

Maximizing Insights with Power BI Embedded: Seamless Data Integration for Enhanced User Experience

Maximizing Insights with Power BI Embedded:

Seamless Data Integration for Enhanced User Experience

In today’s fast-paced, data-driven environment, businesses across industries must continually find ways to provide actionable insights while keeping users within the context of their day-to-day operations. Power BI Embedded, a feature of Microsoft’s Power BI platform, is revolutionizing how organizations deliver real-time analytics and data visualizations directly to users—without requiring them to leave their current applications.

In this blog, we’ll explore what Power BI Embedded is, its key features, benefits, and use cases, while also highlighting how Curate Consulting Services can assist organizations in finding the right talent to implement Power BI Embedded solutions effectively

What is Power BI Embedded?

Power BI Embedded is a service offered by Microsoft that allows organizations to integrate Power BI reports, dashboards, and data visualizations into their own applications, websites, or products. Instead of requiring users to access separate tools for analytics, Power BI Embedded ensures that data insights are brought directly to users within the context of their workflow, making data analysis more intuitive and accessible.

For organizations, this means offering rich, interactive analytics capabilities right where users need them—whether it’s an eCommerce platform that helps merchants track sales data or a healthcare system providing doctors with real-time patient analytics. Power BI Embedded turns data into a core part of the user experience.

Key Features of Power BI Embedded

To understand how Power BI Embedded works, let’s dive into its key features and components:

  1. Power BI Service
    Power BI Embedded relies on the Power BI Service, where reports, dashboards, and visualizations are created, published, and hosted. These reports are then made available for embedding into applications, providing a cloud-based, scalable infrastructure for analytics.

  2. Embedding Options
    Microsoft offers multiple methods for embedding Power BI content, including JavaScript API, REST API, and Power BI SDKs for various programming languages. These options enable developers to embed content seamlessly and customize the integration to fit their needs.

  3. Authentication and Authorization
    Organizations can leverage Azure Active Directory (AAD) for managing user access and authentication to embedded content. This ensures compliance with data security standards while providing role-based access to users.

  4. Customization
    Power BI Embedded allows developers to tailor the appearance of dashboards to match the branding and look of their application. From colors and themes to layout designs, embedded reports can be customized for a seamless user experience.

  5. Interactivity
    Users can interact with data within embedded reports, just as they would within the Power BI platform. They can filter data, drill down into reports, and explore data through intuitive and interactive visualizations, providing a deeper understanding of the metrics.

  6. Real-Time Data Access
    Embedded Power BI content supports both real-time and batch data updates. This ensures that users have access to the latest information, no matter the type of data source—whether on-premises or cloud-based.

  7. Scalability
    Power BI Embedded is designed to support large datasets and handle increasing user demands. As your organization grows, Power BI scales dynamically, ensuring optimal performance.

  8. Extensive Developer Resources
    Microsoft provides robust support for developers looking to implement Power BI Embedded. Resources include detailed documentation, APIs, SDKs, and sample code to guide the integration and customization process.

Benefits of Power BI Embedded

1. Enhanced Data Insights

Power BI Embedded offers organizations the ability to deliver robust data experiences within their own applications. By integrating interactive dashboards and reports, businesses enable users to visualize, analyze, and interact with data in real-time, all within the context of their daily activities.

2. New Monetization Opportunities

For software vendors and service providers, Power BI Embedded presents an opportunity to monetize analytics by offering premium data insights as part of their product. By charging users based on the complexity or usage of embedded analytics features, businesses can create new revenue streams.

3. Improved Workflow Efficiency

By bringing data directly to users, Power BI Embedded eliminates the need to switch between platforms, streamlining workflows and improving productivity. Users can access and analyze data within the same environment they use to complete other tasks, reducing friction and improving decision-making speed.

4. Data Security and Governance

Organizations can maintain control over how data is accessed, ensuring compliance with regulations like GDPR and HIPAA. Power BI Embedded uses Azure Active Directory to authenticate users and enforce role-based access, keeping data secure while providing flexible user permissions.

5. Customization for a Branded Experience

Power BI Embedded allows organizations to create a consistent and branded user experience. By customizing the appearance of reports and dashboards, businesses can ensure that the embedded analytics blend seamlessly into the look and feel of their applications.

6. Real-Time Data for Real-Time Decisions

For industries that rely on real-time data—such as finance, healthcare, and eCommerce—Power BI Embedded supports live data connections. This ensures that decisions are based on the most up-to-date information, providing a competitive advantage in fast-moving environments.

Applications of Power BI Embedded

1. Software Vendors

For software providers, embedding Power BI reports adds significant value to their product offerings. SaaS platforms, CRM tools, and other software applications can use embedded Power BI to offer built-in analytics, allowing users to visualize their data directly within the application. This not only enhances the user experience but also increases the product’s overall value proposition.

2. Healthcare

Healthcare providers can leverage Power BI Embedded to offer clinicians access to real-time patient data and analytics directly within electronic health records (EHR) systems. Doctors and administrators can monitor patient outcomes, view health trends, and track operational performance without leaving their medical software.

3. Financial Services

In the financial services sector, embedded Power BI dashboards allow users to track investment portfolios, monitor financial transactions, and analyze market data. By integrating Power BI into banking apps or investment platforms, financial organizations empower customers to make informed decisions based on real-time data.

4. eCommerce

E-commerce platforms can use Power BI Embedded to offer merchants detailed insights into sales performance, inventory management, and customer behavior. With embedded analytics, merchants can make data-driven decisions to optimize their operations and marketing strategies.

5. Education

Educational institutions and platforms can use Power BI Embedded to provide students and educators with data-driven insights. Whether tracking academic performance or evaluating course effectiveness, embedded analytics can drive better learning outcomes by making data accessible and actionable.

How Curate Consulting Can Help You Find Specialized Power BI Embedded Talent

The integration of Power BI Embedded requires specialized expertise to ensure seamless implementation and optimal performance. This is where Curate Consulting Services comes in. We specialize in connecting businesses with top-tier professionals skilled in Power BI Embedded, ensuring that your organization can make the most of this powerful tool.

Our services include:

  • Experienced Power BI Developers: Experts in embedding Power BI dashboards into applications, these professionals ensure smooth integration and customization to match your brand and user requirements.
  • Data Analysts and BI Specialists: These professionals can help your organization transform raw data into meaningful insights, creating customized Power BI reports that offer real-time analytics and decision-making support.
  • Consulting Services: Whether you need a one-time project or ongoing support, Curate Consulting provides comprehensive consulting services to guide you through the development and deployment of Power BI Embedded solutions.

Our talent network ensures that your organization has access to the right professionals with the expertise to successfully implement and scale Power BI Embedded solutions.

Conclusion: Why Power BI Embedded is a Game-Changer

Power BI Embedded empowers organizations to integrate rich, interactive data visualizations directly into their applications, enhancing user experiences and streamlining workflows. By providing real-time data insights and allowing for seamless, branded integration, Power BI Embedded transforms how businesses deliver analytics.

16Sep

Unlocking the Power of Tableau Embedded: Enhance Data Insights and User Experience

Unlocking the Power of Tableau Embedded:

Enhancing Data Insights and User Experience

In today’s data-driven world, organizations must provide real-time, actionable insights that can be easily accessed by end-users across various industries. Tableau, a leader in data visualization and business intelligence (BI), has long been recognized for its ability to turn raw data into interactive dashboards and reports. However, organizations are increasingly seeking ways to bring these powerful data insights directly into their applications, without forcing users to leave their familiar interfaces. This is where Tableau Embedded comes into play.

Tableau Embedded offers a seamless integration of Tableau’s interactive dashboards, reports, and visualizations into any web application, product, or website. Whether you’re a software vendor, a healthcare provider, or an eCommerce platform, Tableau Embedded delivers data analytics directly to your users, enriching their experience and enhancing decision-making.

This blog explores the key features, benefits, and use cases of Tableau Embedded, while also highlighting how Curate Consulting Services can help organizations implement this transformative technology with specialized talent.

What is Tableau Embedded?

At its core, Tableau Embedded is a feature of the Tableau platform that enables organizations to integrate Tableau’s powerful data visualization tools directly into their applications. Users no longer need to switch between multiple tools or systems to access insights—data becomes an integral part of the user experience.

With Tableau Embedded, companies can offer their users fully interactive dashboards, with the ability to apply filters, drill down into data, and explore insights—all within the application’s existing interface. This capability can transform the way businesses offer analytics, making data more accessible and actionable.

Key Features of Tableau Embedded

To understand why Tableau Embedded is such a valuable tool, let’s break down its key components and features:

  1. Tableau Server or Tableau Online
    Tableau Embedded requires a Tableau Server or Tableau Online deployment. Organizations host their dashboards and visualizations on these platforms, which act as the backbone for delivering embedded analytics to users.

  2. Multiple Embedding Options
    Tableau provides various methods to embed content, including the JavaScript API, REST API, and Single Sign-On (SSO) capabilities. These tools give developers flexibility in customizing how Tableau dashboards are embedded, whether for full integration or partial data views.

  3. Interactive Dashboards
    Tableau Embedded doesn’t just provide static reports. Users can interact with the data by applying filters, drilling into details, and customizing their views. This interactivity is vital for extracting deeper insights from data.

  4. Customizable Look and Feel
    Tableau Embedded allows developers to customize the appearance of dashboards to match their application’s branding. This includes adjusting colors, fonts, and layouts to create a cohesive user experience.

  5. Authentication and Security
    To ensure that only authorized users can access embedded analytics, Tableau supports integration with organization-specific authentication systems, such as OAuth or SAML. This ensures that security and compliance standards are maintained.

  6. Real-Time Data Access
    Tableau Embedded connects to a wide range of data sources, from traditional databases to live data streams, ensuring that users always have access to the most up-to-date information.

  7. Scalability
    As businesses grow, so does the need to handle larger datasets and an increasing number of users. Tableau Embedded is designed to scale, supporting both small and large organizations effectively.

Benefits of Tableau Embedded

1. Enhanced Data Insights

Organizations can offer users an enriched data experience within the flow of their daily operations. Embedding Tableau within existing applications makes it easier for end-users to access and interpret data, leading to better, data-driven decision-making.

2. Monetization Opportunities

For companies looking to provide data analytics as a service, Tableau Embedded opens up new revenue streams. By offering advanced data visualization features as part of a product, businesses can create premium services and add value for their customers.

3. Streamlined Workflows

Tableau Embedded eliminates the need for users to jump between applications to access insights. With data analytics integrated into their existing workflows, users can maintain focus, improving productivity and efficiency.

4. Data Governance and Security

Organizations can maintain control over data security and access through Tableau’s robust authentication mechanisms. This ensures that data privacy and regulatory compliance are met, which is critical in industries like healthcare and finance.

5. Real-Time Analytics

For industries that rely on up-to-the-minute information, such as financial services or healthcare, Tableau Embedded provides access to real-time data, enabling users to make quick, informed decisions.

Applications and Use Cases of Tableau Embedded

Tableau Embedded finds applications across a wide range of industries, each leveraging its data visualization capabilities to provide better user experiences and actionable insights.

1. Software Vendors

Software companies can differentiate their products by embedding Tableau to offer built-in analytics. This adds value for customers, as they can access real-time data and generate reports without the need for additional tools.

2. Healthcare

Healthcare providers can embed Tableau into their systems to offer interactive dashboards for doctors and administrators. These dashboards could track patient outcomes, analyze trends in healthcare delivery, or monitor system-wide efficiency in real time.

3. Financial Services

Banks and investment firms can use Tableau Embedded to offer customers dynamic insights into their accounts, investments, and market trends. Interactive dashboards allow customers to drill down into their financial data, improving the overall user experience.

4. eCommerce

E-commerce platforms can use embedded Tableau to provide sellers with insights into their sales performance, inventory levels, and customer behavior. These insights help businesses optimize their operations and make data-driven decisions that enhance profitability.

5. Education

In educational institutions, Tableau Embedded can provide students and instructors with valuable data-driven insights. Whether tracking academic performance or evaluating course effectiveness, embedded analytics can empower data-informed decisions in education.

How Curate Consulting Can Help You Find Specialized Tableau Talent

As organizations look to harness the full potential of Tableau Embedded, they often need specialized expertise to ensure seamless implementation and integration. That’s where Curate Consulting Services comes in.

At Curate Consulting, we specialize in finding and placing top talent with expertise in Tableau and embedded analytics. Our team understands the complexities of embedding Tableau into existing systems and can connect you with skilled developers, data analysts, and BI specialists who can bring your vision to life.

Whether you’re looking to build a custom data solution for your software platform or need an expert to manage Tableau Server deployments, Curate Consulting is here to support your needs. We provide:

  • Specialized Tableau Developers who can customize and integrate Tableau into your applications seamlessly.
  • Data Analysts and Visualization Experts who know how to turn raw data into actionable insights using Tableau.
  • Project Managers experienced in leading BI initiatives from concept to completion, ensuring timely delivery and successful outcomes.

Partnering with Curate Consulting gives you access to a network of talented professionals who can help you stay ahead of the competition in today’s data-driven landscape.

Conclusion: Why Tableau Embedded is a Game-Changer

Tableau Embedded is not just a feature—it’s a transformative tool that can significantly enhance user experiences and business outcomes across industries. By seamlessly integrating Tableau’s interactive dashboards and visualizations into your applications, you provide users with the insights they need, where they need them.

15Sep

Maximizing Excel’s Potential: A Comprehensive Guide to the Analysis ToolPak Add-In

Maximizing Excel’s Potential:

A Comprehensive Guide to the Analysis ToolPak Add-In

In the world of business, data is king. Every day, organizations handle vast amounts of data, and the ability to analyze this data effectively is crucial for making informed decisions, driving growth, and gaining competitive advantage. For professionals, researchers, and analysts who rely on Microsoft Excel to organize and analyze data, the Analysis ToolPak is a game-changer.

The Analysis ToolPak is an Excel add-in that provides powerful data analysis tools, going far beyond Excel’s standard capabilities. Whether you’re performing complex statistical tests, running financial models, or generating forecasts, the Analysis ToolPak transforms Excel into a robust data analysis platform. In this blog, we’ll explore what the Analysis ToolPak is, how it can help businesses and professionals, and how Curate Consulting Services can assist organizations in finding the specialized talent they need to leverage this tool effectively.

What Is the Analysis ToolPak?

The Analysis ToolPak is an Excel add-in designed for advanced data analysis. It offers a wide range of tools for performing statistical, financial, and engineering analysis, making it an essential tool for anyone working with large datasets. From calculating moving averages for time-series data to conducting regression analysis, the Analysis ToolPak simplifies complex calculations, allowing professionals to extract meaningful insights from their data.

Although it’s not enabled by default in Excel, installing the Analysis ToolPak is straightforward. Once activated, users can access its functions via the “Data” tab in Excel, under “Data Analysis.” This seamless integration means users can perform sophisticated analyses without ever leaving the familiar Excel environment.

Key Features of the Analysis ToolPak

The Analysis ToolPak offers a range of advanced data analysis tools, each tailored to specific analytical needs. Let’s dive into some of its most powerful features:

1. Statistical Analysis

Statistical analysis is one of the core strengths of the Analysis ToolPak. Users can perform descriptive statistics such as calculating the mean, median, and variance of a dataset. The add-in also allows for hypothesis testing, offering tools like t-tests, ANOVA (Analysis of Variance), correlation analysis, and regression analysis. This makes it a valuable asset for researchers, analysts, and data scientists who need to validate hypotheses or identify relationships between variables.

2. Financial Functions

Financial professionals can leverage the Analysis ToolPak to perform advanced financial calculations. For instance, it includes functions to calculate Net Present Value (NPV), Internal Rate of Return (IRR), and payment schedules for loans or investments. These functions enable finance teams to create detailed financial models, analyze cash flows, and make data-driven investment decisions.

3. Engineering Functions

For engineers, the Analysis ToolPak provides a suite of technical and scientific functions. Whether it’s running complex calculations for design optimization or analyzing data from engineering experiments, the ToolPak offers functions for solving problems in scientific and engineering domains.

4. Regression Analysis

One of the most widely used functions in the Analysis ToolPak is multiple regression analysis. This tool helps users model relationships between variables, making it possible to predict outcomes and assess the strength of those relationships. Whether it’s predicting sales trends or determining factors that influence operational performance, regression analysis is crucial for decision-making.

5. Histograms and Pareto Charts

Visualizing data is often the key to understanding it. The Analysis ToolPak allows users to create histograms and Pareto charts, providing a graphical representation of data distributions. These visual tools help businesses quickly identify trends, anomalies, or outliers in their datasets.

6. Random Number Generation and Sampling

The ToolPak includes functions for random number generation based on various statistical distributions, which is useful for simulations and modeling. Additionally, users can select random samples from a dataset, a function particularly valuable for researchers conducting surveys or experiments.

7. Moving Averages

For businesses involved in forecasting or trend analysis, the moving averages function is a powerful tool. It allows users to smooth out short-term fluctuations in data and identify long-term trends, making it easier to forecast sales, production demands, or market trends.

8. Exponential Smoothing

Another forecasting tool provided by the Analysis ToolPak is exponential smoothing, which analyzes time-series data to generate forecasts. This technique gives more weight to recent observations, making it particularly useful for predicting trends in volatile or fast-moving markets.

9. Solver Integration

In addition to its standalone capabilities, the Analysis ToolPak often works in tandem with Solver, another Excel add-in. Solver is designed for optimization problems and is commonly used in conjunction with data analysis tasks like resource allocation, production planning, and goal-seeking.

Why Businesses Need the Analysis ToolPak

For businesses, the ability to perform advanced data analysis can mean the difference between success and failure. In an era where decisions must be made quickly and with precision, tools like the Analysis ToolPak enable organizations to harness the power of their data effectively.

Here are a few reasons why the Analysis ToolPak is invaluable for businesses:

  • Data-Driven Decisions: By providing advanced statistical and analytical functions, the ToolPak helps businesses make informed decisions based on data, rather than intuition.

  • Efficiency: Performing complex analyses manually can be time-consuming and error-prone. The Analysis ToolPak automates these processes, ensuring accuracy and saving valuable time.

  • Versatility: The ToolPak is flexible enough to be used across industries—whether it’s financial modeling, engineering optimization, or project forecasting, businesses can apply its tools to a variety of challenges.

  • Cost-Effective: As an add-in for Excel, the Analysis ToolPak offers robust analytical capabilities without the need for expensive, third-party software solutions.

However, the real value of the Analysis ToolPak lies in having skilled professionals who know how to use it effectively. This is where Curate Consulting Services can help businesses get the most out of this powerful tool.

Curate Consulting Services: Connecting You with Data Analysis Experts

At Curate Consulting Services, we understand that the success of any data-driven initiative depends not just on having the right tools, but also on having the right talent. While the Analysis ToolPak provides excellent functionality for data analysis, navigating its full capabilities requires specialized knowledge and experience.

Here’s how Curate Consulting Services can help:

1. Providing Specialized Talent

Whether your organization needs a financial analyst skilled in NPV and IRR calculations, a statistician familiar with hypothesis testing and regression analysis, or an engineer with experience in scientific data analysis, Curate Consulting Services can connect you with professionals who possess deep expertise in using the Analysis ToolPak. We have a vast network of candidates with the technical and industry-specific knowledge necessary to perform advanced data analysis.

2. Tailored Staffing Solutions

We don’t believe in a one-size-fits-all approach. Our staffing solutions are tailored to your unique business needs, ensuring that the talent you receive is not only proficient in using the Analysis ToolPak but also understands the context in which your organization operates.

3. Consulting and Training Services

Beyond staffing, Curate Consulting Services offers consulting and training services to help your in-house team master the Analysis ToolPak. Whether you need short-term project support or long-term solutions, we provide comprehensive assistance in implementing data analysis workflows and maximizing the value of Excel’s powerful tools.

4. Long-Term Partnerships

Our commitment to clients goes beyond just filling immediate staffing needs. We strive to build long-term relationships with organizations, ensuring they have continuous access to top-tier talent and expertise as their data analysis needs evolve.

Conclusion: Unlocking the Full Potential of Excel with the Analysis ToolPak

The Analysis ToolPak turns Excel into a powerful platform for advanced data analysis, providing essential tools for professionals across industries. From statistical analysis to financial modeling, the ToolPak allows businesses to make data-driven decisions, forecast trends, and optimize their operations.